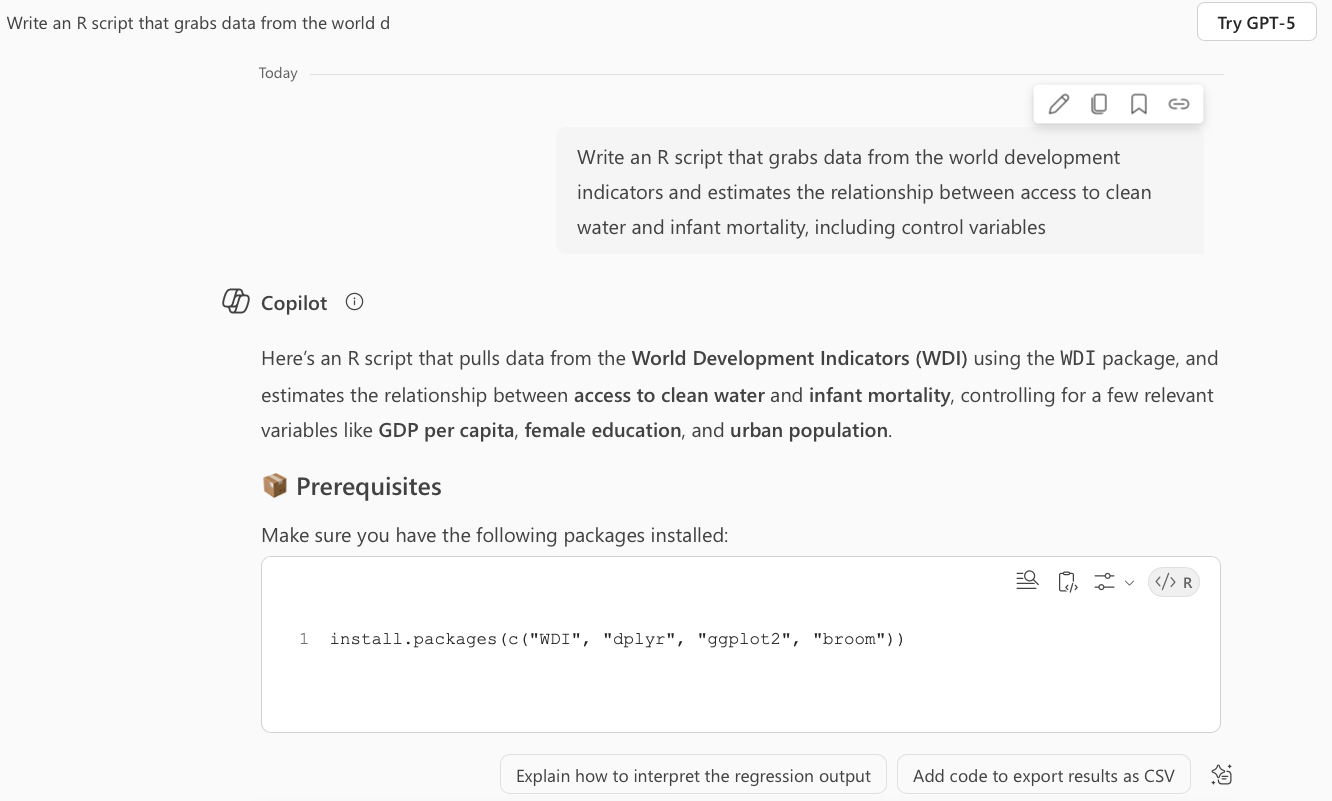
# Load required libraries
library(WDI)
library(dplyr)
library(ggplot2)
library(broom)

# Define indicators
indicators <- c(
  "SH.H2O.SAFE.ZS",   # Access to clean water (% of population)
  "SP.DYN.IMRT.IN",   # Infant mortality rate (per 1,000 live births)
  "NY.GDP.PCAP.CD",   # GDP per capita (current US$)
  "SE.PRM.CMPT.ZS",   # Primary school completion rate (% of relevant age group)
  "SP.URB.TOTL.IN.ZS" # Urban population (% of total)
)

# Download data for the last available year
data_raw <- WDI(country = "all", indicator = indicators, extra = TRUE, latest = 1)

# Clean and filter data
data_clean <- data_raw %>%
  filter(region != "Aggregates") %>%  # Remove aggregate regions
  select(
    country, region,
    access_water = SH.H2O.SAFE.ZS,
    infant_mortality = SP.DYN.IMRT.IN,
    gdp_per_capita = NY.GDP.PCAP.CD,
    education = SE.PRM.CMPT.ZS,
    urban_pop = SP.URB.TOTL.IN.ZS
  ) %>%
  na.omit()

# Run linear regression
model <- lm(infant_mortality ~ access_water + gdp_per_capita + education + urban_pop, data = data_clean)

# Summarize results
summary(model)

# Tidy output
tidy(model)

# Optional: Plot relationship between access to water and infant mortality
ggplot(data_clean, aes(x = access_water, y = infant_mortality)) +
  geom_point(alpha = 0.6) +
  geom_smooth(method = "lm", se = TRUE, color = "blue") +
  labs(
    title = "Access to Clean Water vs Infant Mortality",
    x = "Access to Clean Water (% of population)",
    y = "Infant Mortality (per 1,000 live births)"
  ) +
theme_minimal()Coding with AI
Gustavo Diaz
Department of Political Science
Northwestern University
gustavo.diaz@northwestern.edu
gustavodiaz.org
Materials: gustavodiaz.org/statworkshop

Next workshop dates
| Date | Topic | Presenter |
|---|---|---|
| October 21 | A Practical Guide to Ranking Data Analysis in the Social Sciences | Yuki Atsusaka |
| November 11 | Declaring and Diagnosing Research Designs | Alexander Coppock |
Agenda
Should you incorporate AI into your coding workflow?
How not to?
How to? (Github Copilot in RStudio)
Demo
My stance on using AI
Text: No
Images/video: No
Teaching: Yes, I want students to learn how to use it responsibly
Coding: Maybe? I don’t see it much different from online searches
Should you use it for coding?
It feels like this
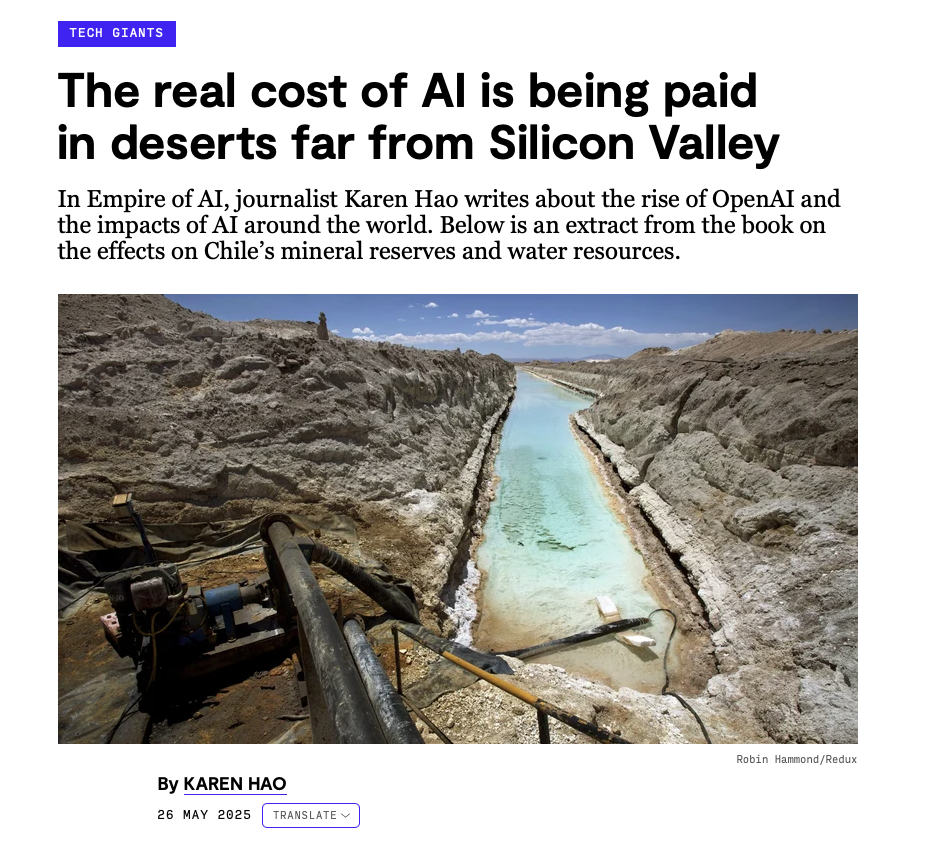
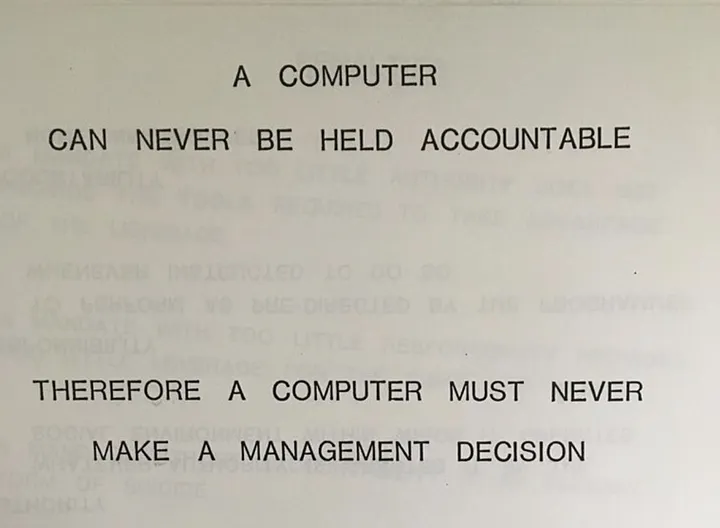
It hides its ethical implications
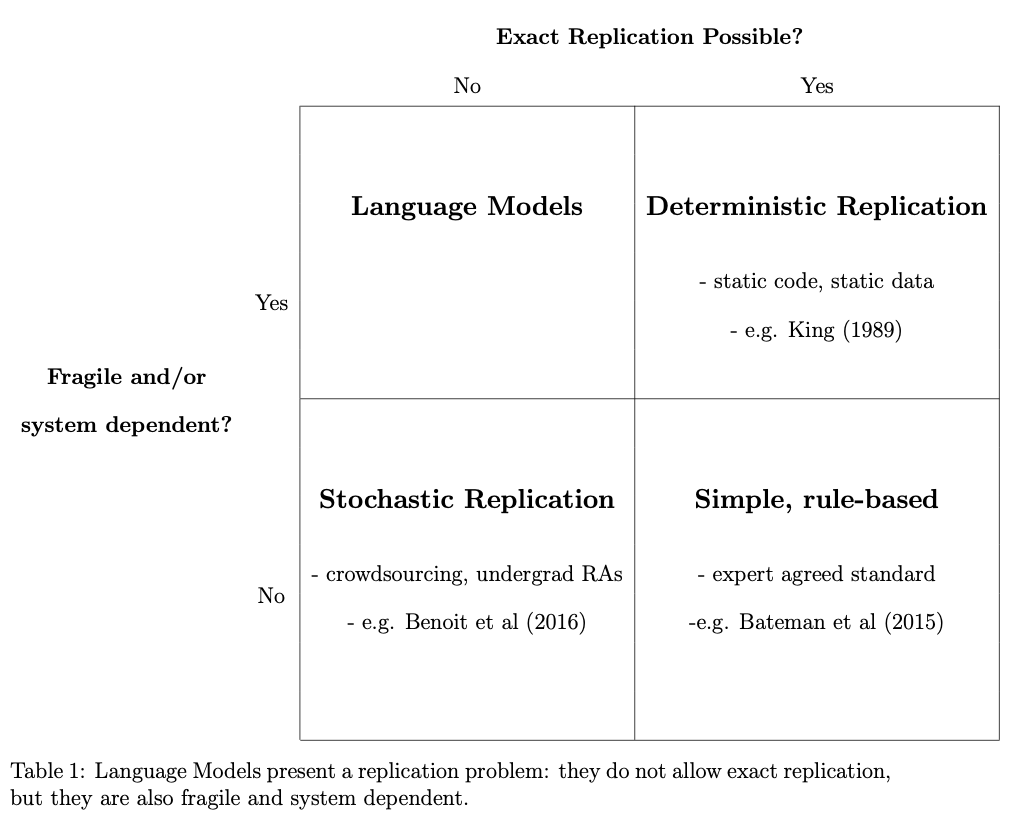
It is not that reliable
How not to use it?
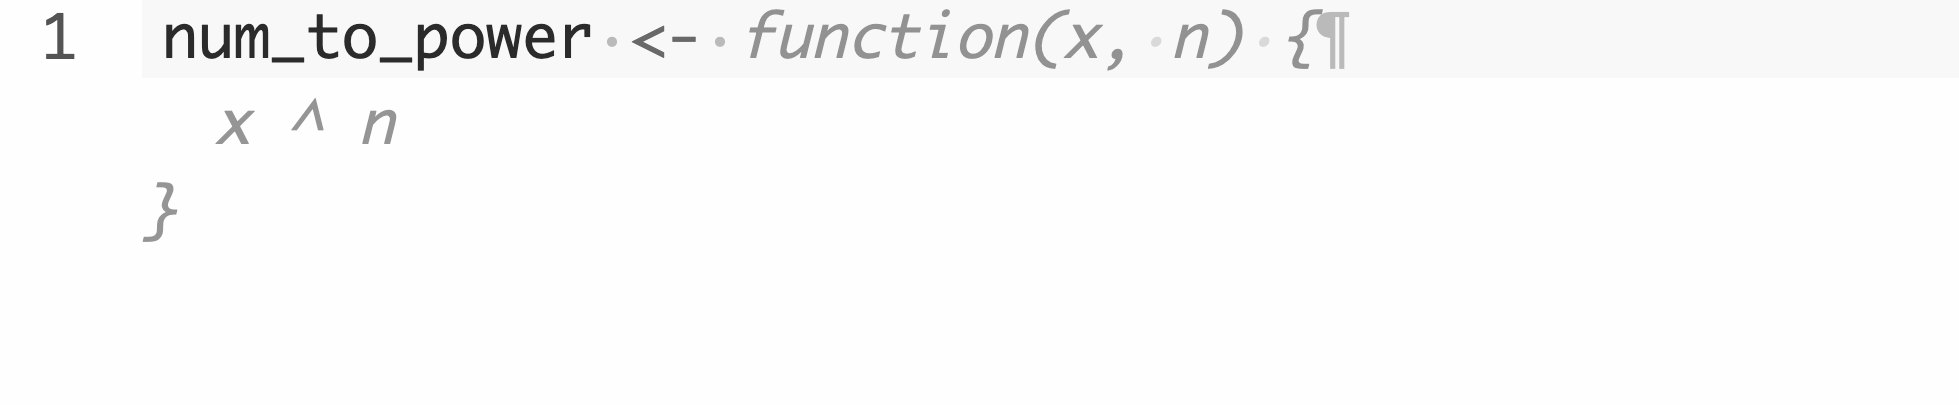
Vibe coding
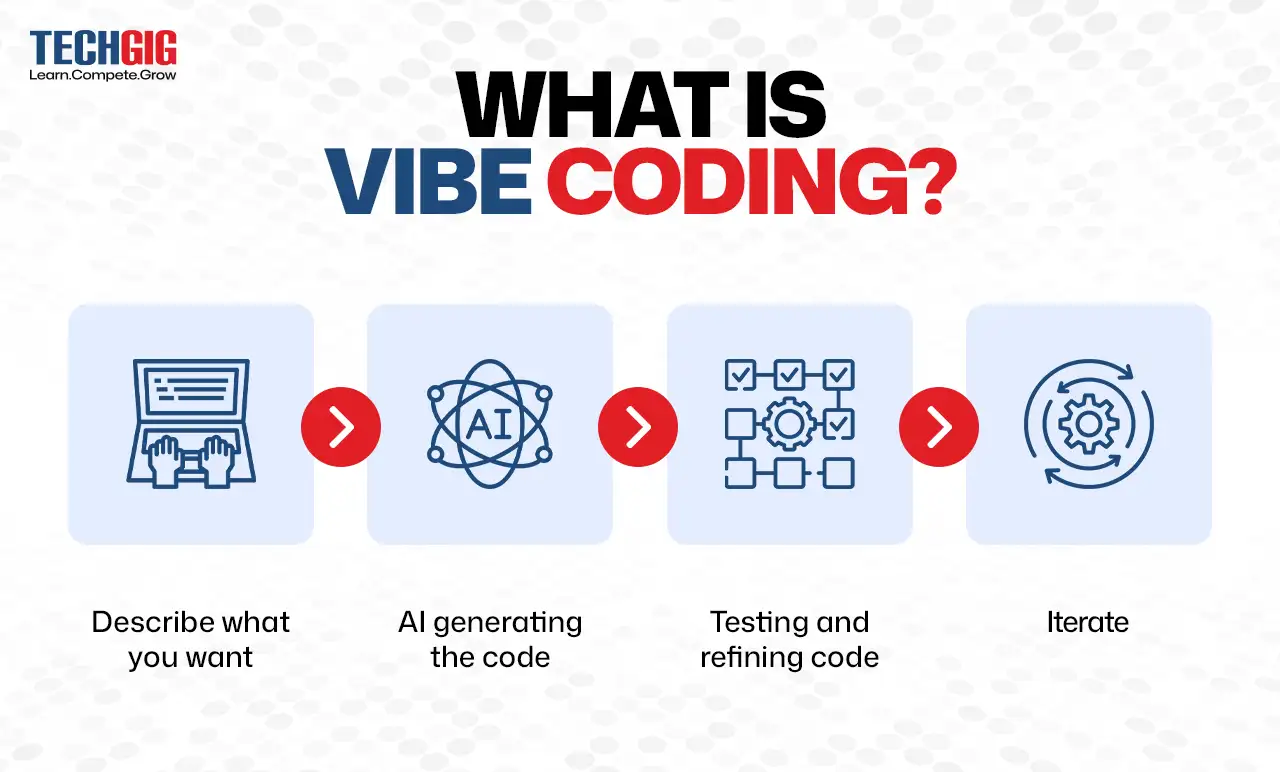
Vibe coding example
Vibe coding output
What is the problem with this?
- Gives you code that works but you don’t know why it works
- Terrible for learning
- Makes important decisions for you
- May use outdated/deprecated packages
- Mistakes may hurt you down the line
How to do it?
Use AI to amplify humans, not replace them
Approaches
AI as a teaching assistant
AI as a collaborator
AI as a TA

AI as a TA
Pros:
- Improves your code
- Less intrusive than AI as collaborator
Cons:
- Lacks context
- Uneven learning
- Messes up your style
AI as a collaborator
Get auto-complete suggestions from Copilot within RStudio
Ingredients:
R and RStudio
Internet connection
GitHub Education Instructions
Create or associate account with Northwestern e-mail
Get your account verified here (with proof of enrollment/employment)
Set up in RStudio
Tools > Global Options > CopilotSet code completion
Tools > Global Option > Code > Completion
Options
Copilot Indexing: Give access to project files?
Copilot Completions: Manual (cmd + \ or ctrl + \) or Automatic (with delay)
Uses
- Auto-complete inline code
Uses
- Questions
# q: what is the definition of standard error?
# a: The standard error (SE) is a statistical measure that quantifies
# the variability or dispersion of a sample statistic,
# such as the sample mean,
# from the true population parameter.
# It provides an estimate of how much the sample mean is expected to
# fluctuate from the actual population mean
# due to random sampling variability.Uses
- Provide context at the top
AI as collaborator
Pros:
You need to know enough to give good instructions
Doesn’t break your flow
Cons:
You need to know enough to give good instructions
Always online
It can be very intrusive (if you let it)